There was a recent thread on the APBA Baseball Facebook page about the 1968 reissue set, namely that Bob Gibson no longer has a Z. For those who may not be familiar, 1968 was the year of the pitcher, and it was a season APBA had a little difficulty creating the first time around.
In the original set, there were three starters who were graded A&C: Bob Gibson (plus an XZ), 31-game winner Denny McLain (XZ), and AL ERA champ (1.60) Luis Tiant (XYZ). In the older formulas, McLain was an “automatic” A&C since he had 30+ wins. At this point, the A&C as a starting grade had only been given once before — two years earlier to Sandy Koufax — although it had been given in the past to OFAS pitchers. To somewhat counter the high number of A and A&C pitchers, cards were given an extra 7.
It would be pretty impossible to get a 1.12 ERA from an A&C, even in the deflated year of 1968. A baseline was set with Tiant getting the A&C for 1.60, and you would think there would need to be some sort of improvement to get to 1.12. The one basic game replay I could find had Gibson’s ERA at 1.55.
In the reissued set, Gibson got an upgrade to A&B (MG 25), but he lost the Z. McLain also got a bump to 25, kept his Z but gained an L (he did give up 31 dingers to lead the AL). Tiant stayed at A&C (MG 20) but lost his Z as well.
In the modern card-making formulas, the loss of Gibson’s Z is not unexpected. The older formulas used BB per 9 innings, and the line was somewhere around 3.0. Gibson, at 1.8, had no problem getting a Z. However, modern formulas use unintentional walks per batter faced. The line for the 1968 NL set was around 0.046. Ron Reed (0.045) got a Z, while Ray Washburn (0.047) did not. Gibson was at 0.048. Since Gibson faced so few batters, by using BB/9 there was a somewhat inflated sense of having above-average control.
Of course, with BBW and League Manager, we can test to see how well Gibson’s new grade and now average control worked. I replayed the 1968 season 10 times, using Duke Robinson as the manager, adding all players to a roster somewhere, and limiting AIM to game injuries only. Here are the overall league stats (both NL and AL) of the 10 tests:
I present the overall stats to see if there is anything is out of whack compared to the real life. The first thing that stands out is that the replays produced on average 0.5 more runs per game despite the averages pretty much on target. This is mostly an effect of not enough double plays, as the average replay had 1.45 DP per game as opposed to 1.74 in real life. Not trying to go too deep into the weeds, but I would assume that the formulas to determine 24’s was not adjusted to a lower amount of base runners to trigger double plays.
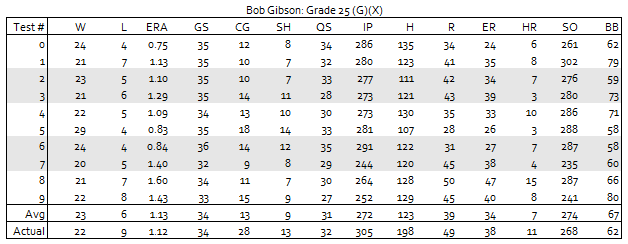
So routing back to Gibson, it looks like the changes to the card are right on the money:

Since it is impossible for him to get the proper mix of singles vs. extra base hits, fewer singles are produced to compensate for the hard-to-stop doubles and triples. The G also helped somewhat, as only once was he above average in HR. The Micromanager did pull him early, so he did not get as many innings as he should have. His BB/PA was 0.053, obviously higher than his real life 0.048, but not chart busting. Also, with Gibson rarely having runners on to begin with, the Z would have less effect than it would for the average pitcher.
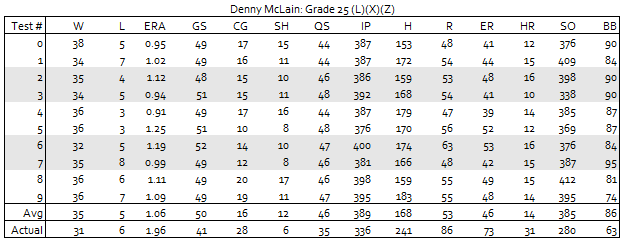
However, there is someone whose card needs adjustment. And that’s Gibson’s AL counterpart: Denny McLain. The pitching between the two leagues was pretty indistinguishable, so you would expect that McLain would have a lower grade. However, as mentioned earlier, it is also a 25 and with a Z, but also with an L. Those subratings are going pretty much going to cancel each other out, and the only difference between him and Gibson is the G. However, that’s not enough of a difference to replicate McLain’s somewhat higher ERA (1.96):
The biggest problem is his home run total. The only time with a grade that high an L matters is with either runners on 1st-2nd or runners on 2nd-3rd. And with McLain not allowing a lot of baserunners, it really has no impact. He likely needs to be an M. His BB/PA, even with the Z, is higher (0.62) than Gibson’s (0.053), and I really don’t have an explanation for that. The Micromanager consistently gave him more starts, which I think would be to him being pulled more often than he should be (he is a Q4 for some bizarre reason) which allowed him to pretty much be on a 4-day rotation.
A lot of this is going to depend what you want to consider the benchmark for a successful recreation of his season. Trying to hit 31 wins in 41 starts is going to difficult, as his replay stats shows he only wins 70% of his starts, and 70% of 41 is only going to be 29 wins. The better thing is to get past the issue that he had 31 wins to begin with. The Tigers as an offense scored 4.15 runs per 9 innings, and McLain gave up 2.30 when accounting for unearned runs. Those numbers would normally mean a 25-8 season, but he got lucky in the fact he only had 4 no-decisions, he had 5.2 run support, and didn’t have a save blown by a reliever.
I did try one simulation with McLain at 22MXZ, and it was a little closer (even though he got 50 starts again): 30-9, 1.70 ERA, 30 HR and “only” 367 strikeouts. This is probably a better grade to use, although 30 wins is going to be highly unlikely.
And just for kicks, here are the leaders for each of the 10 simulations. The Tigers not once were lower than their win total. The AL had an under .300 batting champ in one season and an under 100-RBI champ in another. Also looks like Ferguson Jenkins strikeout benefits a little bit from being just on the X side of the X/Y line.


I would be afraid that if I took away his “Z” I would soon have a “42” on my own card.
Lol!! Brilliant, Warren!
I love this blog! I would love a subscribe button, but I think I can remember APBAMetrics when I want an APBA fix.