In The Box

In my opinion, one of the weaknesses in the APBA Hockey game is the penalty system.  Unfortunately, the original system doled out too many penalties and each successive version has tried to kludge the system rather than just starting from scratch.  This article will go into how the system works, how to calculate what numbers a player should receive and a brief exploration of a better system.

The Current System

The play numbers 33 to 40 are used to dole out the trips to the sin bin, and essentially go in order from least severe (33) to most severe (40).  Assuming that the average player spends 80% in Forecheck 2, 5% in Forecheck 1, 5% in Forecheck 3, 5% in Power Play and 5% in Shorthanded, each number should produce the following assuming you use none of the enhancements:

  • A 33 is a coincidental penalty in Forecheck 2 72% of the time and a minor in Forecheck 3 and power play, so this will produce a coincidental penalty 58% of the time and a minor 10% of the time.
  • A 34 is a minor penalty in Forecheck 2, a coincidental penalty in Forecheck 1 and shorthanded, and a coincidental penalty 72% of the time in Forecheck 3 and power play.  This is a minor penalty 80% of the time and a coincidental penalty 17% of the time.
  • A 35 is always a minor
  • A 36 is a flight 72% of the time in Forecheck 2 and always a fight in Forecheck 3 and power play, producing a fight 78% of the time.
  • A 37 is a fight in Forecheck 2, 3 and power play, or 90% of the time.
  • A 38 is a fight in Forecheck 2, 3, power play and a fight 72% of the time in Forecheck 1 and shorthanded, or 97% of the time.
  • A 39 is a fight
  • A 40 is a major 42% of the time in Forecheck 3, 28% of the time in Forecheck 2 and 8% in Forecheck 1, otherwise it is a fight.  This returns a fight 73% of the time and a major 27% of the time.

Continue reading

The Single Column Six

In the last dozen years or so, an occasional card will end up with a weird combination of 0s and 6s in the first column. Prior to this time, the only extra base hit you could have with a 0 was a 1. So is there any rhyme or reason to who gets this combo.

Let’s first take a look to see who has it.  In the 2014 set, discounting pitchers and anyone else with less than 100 PA, there are 17 players with a 0 on 66 and a 6 either on 11 or 33 or both.  Let’s take a look at the “Special 17”:

  • Two players have 6-6-0: Conor Gillaspie and Starlin Castro
  • Two players have 6-0-0: Randal Grichuk and Chris Heisey
  • The other 13 have 6-0: Corey Hart, Dee Gordon, Stefen Romero, Grant Green, Paul Konerko, Elian Herrera, Jason Kipnis, Nate Schierholtz, Allen Craig, Emilio Bonifacio, Gerald Laird, Joaquin Arias and Clint Barmes.

So what do they have in common?

  • None of the players have enough HR to qualify for a first column 1.
  • All of them have enough doubles to qualify for at least one first column 6.
Randal Grichuk and John Jaso

Two players with similar power stats, but different power numbers, or are they different?

And strangely that’s it. Some thoughts I had:

Hypothesis #1: These players all hit a homer with just a runner on 3rd, as a 6 is a HR in that situation: This does not hold water, as four of the players (Herrera, Laird, Arias and Barmes) did not hit a homer in 2014.

Hypothesis #2: These players were all out stretching a double into a triple, and a single column 6 is used as a way to have that happen in the computer game.  49 players in 2014 were out stretching a double into a triple.  Only two of the “Special 17” were in that group (Castro and Green), so it’s not that.

Hypothesis #3: It has something to do with batting handicaps.  Nope, all of the ratings except 2 are represented and one PL is included.

Hypothesis #4: It has something to do with position or bat-handedness.  Nope, every position is represented, every batting hand is represented.  Oddly, they all throw right, but that is likely a coincidence.

Hypothesis #5: They have no second-column singles.  That actually works for a lot of the players, but it does not work for three of them (Laird, Arias and Barmes).

Hypothesis #6: Something weird happens if your only extra base hits are doubles.  This actually has merit.  Three of the group (yet again Laird, Arias and Barmes) did not hit any triples or homers.  Additionally, all other players with at least 100 PA got a single column 6 or 6s except one, Jose Molina.  Jose Molina didn’t really hit enough doubles to warrant even a single column 6, so he was given a 0 with 10 double column 6s).  So we have figured out that if all of your extra base hits are doubles, you will get a single column 6 as long as you can warrant it.  So we’ll remove Laird, Arias and Barmes from the equation, and move on to the “Frustrating 14”.

Hypothesis #7: Let’s revisit #5 since the three removed were the outliers in Hypothesis #5.  So we have 14 players who have no double column singles for those players who have a double column.  There are 8 other players who also would qualify in this situation, yet do not have the first column 6.  So it’s something more than this?

Data Set Removal #1: One of the 8 players without the single column 6, Andrew Romine, does not qualify for a single column 6 since he only qualifies for one extra-base hit number and a quarter of that number should be a homer.  So he is given a single 0 and we’re not going to worry about him in the later hypothesis, so we’ll call this other group the “Silly 7”.

Hypothesis #8: Is it something to do with the double rate?  No, as the players seem to mix.  The highest ranked doubles hitter in the combination of the two groups is in the Frustrating 14 (Gillaspie) but the second is in the Silly 7 (Jayson Werth).

Hypothesis #9: Is it something to do with the triple rate?  Each group has a player with no triples, and the other players mix again, so it isn’t this.

Hypothesis #10: Is it something to do with the home run rate?  There is a weird thing where the lowest number in the Silly 7 is 0.65, but there are players in the Frustrating 14 with a higher rate.

Since I can’t think of anything else that seems to work, I’m going to go with this to determine whether a player gets a 6-0, 6-6-0 or 6-0-0 combination:

  • Player must have at least one double for each 34.25 PA.
  • Player must have fewer than one homer for each 34.25 PA.
  • If the player has hit no triples or homers, the player will have at least one first column 6 and then the requisite number of 0s.
  • If the player will not have any single column singles, the player may have at least one first column 6, but they may not.

Do you have a hypothesis of your own?  Then don’t be a stranger, leave a comment…


The Dreaded Shootout

I am an avid player of the APBA hockey game but I only play tournaments. Since I need to play playoff-style overtimes, I never had to deal with the shootout. However, when I got the 2014 Olympic set, I would have to use the shootout, because that’s what the Olympics did.  Even though my Olympic replay was going to tweak the seedings a bit by using the 1980 system rather than the 2014 system, I’m still keeping the 2014 game rules.

So in my first game, Switzerland pushed Russia to a shootout.  So I reviewed the rules:

  • Get the shot range for the shooter
  • Add 10 (a.k.a 6) to the shot range, and use either this number or 43, whichever is lower
  • Roll the dice for the shot
  • If the shot roll is within range, roll for the goalie. If you roll a 1 for the goalie, it is not a goal, otherwise, it is a goal
  • If the shot roll is outside of range, it is not a goal

Rather anti-climatic, despite the Swiss winning the shootout 3-2.  And frankly, I’m a bit worried about the realism.  Recent stat geekery has shown that shot percentages tend to be very volatile, and not a great reflection of offensive ability.  So, me being me, I had to run a few tests. Continue reading

Fielder’s Choice

A while back, I ran a simulation of the various hit numbers. I then did the same thing, concentrating on the pitching grades. This time I’m going to look at fielding, including the arm ratings for catchers and outfielders. The latter prove to be pretty surprising.

First off let’s take a look at the most important stat when comparing the fielding ratings: run differential. I had previously established a baseline of 4.04 runs scored per 36 PA for the average 2012 replay. For all of the different fielding ratings, here are the variances away from that 4.04:

Usage 1 2 3 4 5 6 7 8 9 10
P .03 -.01                
C         .07 .05 .00 -.04 -.04  
1B   .10 .02 -.01 -.06          
2B         .14 .08 .04 -.02 -.04  
3B   .08 .06 .03 -.07 -.06        
SS           .15 .10 .01 -.06 -.09
OF .05 .03 -.01              

One of the things that sticks out is that the “average” rating (e.g.: 2B-7, OF-2) are slightly worse than average run-wise. This is compensated somewhat (with the exception of 3B) by having the average rating of the position over the course of a replay be a little above average. For the outfielders, the sum of the OF divided by 3 is presented, as I had no way to isolate the simulations to just use a certain rating in one of the three fields:

Usage 1 2 3 4 5 6 7 8 9 10 Avg
P .37 .63                 1.63
C         .03 .07 .46 .37 .06   7.35
1B   .15 .35 .28 .22           3.57
2B         .00 .11 .42 .33 .14   7.50
3B   .00 .43 .37 .19 .00         3.76
SS           .05 .12 .59 .20 .03 8.05
LF .28 .53 .19               1.91
CF .01 .31 .68               2.67
RF .21 .48 .31               2.11

There are only two positions where the replay average is below the theoretical average: third base (by a lot) and leftfield (by a little). In total, the team defense averages 38.54: 31.86 in the infield and 6.69 in the outfield. With the shift over the last 20 years of 3B producing the second most errors on a team (rather than 2B), upping the 2B ratings and lowering the 3B ratings is one way to do it.

Looking at the main purpose of the fielding rating (errors), there is little surprise in the correlation between the errors per 36 PA for a rating and the errors per 36 PA for an overall replay.

EDiff 1 2 3 4 5 6 7 8 9 10 Avg
P .02 -.02                 .06
C         .11 .08 .01 -.06 -.07   .10
1B   .06 .01 -.02 -.04           .06
2B         .12 .09 .01 -.02 -.04   .08
3B   .02 .02 -.01 -.05 -.07         .10
SS           .08 .05 .00 -.08 -.10 .15
LF .03 -.01 -.03               .05
CF .06 .02 -.01               .03
RF .04 .00 -.02               .04

A little surprising is that the cliff between those positions where -2 away from the norm (e.g.: C-5 and C-7), the margin between -2 and -1 away is greater than +1 and +2 away. LF-2 is a negative, and CF appears to be the least important position to have an OF-3 in, while it is the most deadly to have an OF-1. A LF-3 can pay dividends, especially by neutralizing that pesky fielding 2 LF error with the bases empty.

A look at hits is not very surprising either, with not much difference between the bad fielders and the good ones:

HDiff 1 2 3 4 5 6 7 8 9 10
P .01 .00                
C         .03 .03 .02 .02 .02  
1B   .06 .00 -.01 -.02          
2B         .05 .01 .02 -.01 -.01  
3B   .03 .03 .03 -.02 .02        
SS           .04 .03 .01 .00 -.02
OF .03 .01 -.01              

A bit of an anomaly at catcher, since the hits were up no matter what the rating. Makes me wonder if there is a little bit of an issue with the baseline I am using where the hits may have been a little low. I also have a feeling that the 3B-6 simulation was a little bit of an outlier on the offense side, as both the run and hit differentials were worse than 3B-5.

Let’s move on to the catcher’s throwing arm in respect to stopping (or enabling) the running game:

C -4 -3 -2 -1 -0 +1 +2 +3 +4 +5 +6 Avg
Rdiff .05 .04 .02 .03 .00 .01 .00 .00 -.01 -.01 .00  
SB% .85 .82 .80 .78 .75 .73 .71 .69 .69 .69 .67 .80
SBA/36 .66 .65 .65 .65 .65 .63 .57 .50 .45 .37 .33 .63
Usage .18 .31 .11 .12 .11 .05 .00 .02 .04 .03 .03 -1.21

This was probably the largest surprise of this simulation. First off, that the average Throw rating was -1.21 (and a median of -3), contributing somewhat to a higher than expected 80% steal success rate. The real-life rate for 2012 was only 74%. I have a feeling that APBA is still basing the ratings off a strict percentage and not curving them. The rate when the MG first came out was in the mid-60s, and a difference between what used to be an average of +1 in older sets going down to -1.21 roughly correlates to a 6% higher success rate.

Also noted that the success rate does go down as the throw rating gets better until about +3, at which it levels off. Taking over is a go/no-go call of sending the runner a lot less. I don’t have a Micromanager utility to check on Duke Robinson to be sure, but that would be my gut feeling. Duke also tended to steal more when then pitcher was higher rated, and laying off when lower rated.

And on the other end of the surprise, it turns out that the OF arm ratings actually have more influence than the defense ratings. Again, I could not split the run differences, but I could check on assists and the playing time of the individual ratings. To keep this from being too ridiculous, I only checked Arm ratings 20, 25, 30, 35 and 40. The usage figures below are based on 20-22, 23-27, 28-32, 33-37 and 38-40.

OF 20 25 30 35 40
Rdiff .08 .07 .03 -.01 -.05
LF A/36 .07 .05 .06 .07 .08
CF A/36 .06 .06 .06 .05 .06
RF A/36 .07 .07 .09 .10 .12
Usage LF .00 .03 .75 .22 .00
Usage CF .00 .01 .38 .59 .01
Usage RF .00 .00 .30 .67 .03

An arm of 40 has more benefits than an OF-3. And an arm of 20 has a higher penalty than an OF-1. Interestingly, in the 2012 set the arm ratings only range from 25-38. When it comes to assists (like errors, runs and hits), the centerfielder has the least influence of the three spots, with the rightfielder having the most. Just a little quirk of APBA to keep in mind when putting together your lineup.

When determining the whole value of a card by including the hit factors from the hitting articles, note that these are not on the same scale. The numbers in this article are based on every play on the field, whether or not the rating was used. The batting numbers only refer to the time that batter is hitting, so a factor must be either multiplied to the hitting numbers or divided from the fielding numbers depending on the expected batting position of the player (a batter batting 1st bats more often than a player batting 9th). If batting 1st-3rd, multiply/divide (whichever you chose) by .12, 4th-6th use .11 and 7th-9th use .10.

Another way to look at it: the difference between a SS-9 and a SS-7 (a dilemma often seen when trying to determine who to play) is roughly equivalent to an extra 1 for a SS-9:

  • The difference between run differentials for a SS-7 (.10) and a SS-9 (-.06) is .16.
  • Just assuming the player bats in the middle of the lineup, you would divide .16 / .11 to get 1.45, which is roughly equivalent to the value of a 1 (1.50).

The other positions on the difference between the standard Fielding 3 and 1 are a little wacky compared to the defensive spectrum we’re used to, basically, don’t worry about 2B and OF so hard and the corners are pretty important:

  • Third Base (difference between 3B-5 and 3B-3): .13 (equivalent to two extra 7s)
  • First Baseman (difference between 1B-4 and 1B-2): .11 (equivalent to an extra 3)
  • Second Baseman (difference between 2B-8 and 2B-6): .10 (equivalent to an extra 6)
  • Catcher (difference between C-8 and C-6): .09 (equivalent to an extra 8 and a 9)
  • Outfielder (by arm, difference between 35 and 25): .08 (equivalent to an extra 9 and a 10)
  • Outfielder (difference between OF-3 and OF-1): .06 (equivalent to an extra 7) (RF is likely most important, a 1 should stay out of CF)
  • Catcher (by arm, difference between +3 and -3): .04 (equivalent to an extra 9)

The C and OF differences are cumulative. For example a C-8/Th+3 would be worth .13 better than a C-6/Th-3 (similar to the 3B-5/3 split) and an OF-3/35 would be .14 better than an OF-1/25 (equivalent to an extra 6 and 9).

Next up will be the other things that can be a factor: batting handicaps, speed ratings and steal ratings .

Making the Grade

In the original National Pastime game, the only thing that a pitcher contributed was hitting.  There were no grades, no subratings, no handicaps.  When APBA came out in 1951, the concept of the grade was added, so now pitchers fell into six classes: A&C, A&B, A, B, C and D.  The grade was pretty much determined by two factors: ERA and innings.  Six years later, the subratings were added: 3 for control and 4 for strikeouts.  You now had 72 different classes of pitchers, but in reality you really had 12: 4 grades and 3 control subratings.  The strikeout subratings were of little overall effect and the A&C and A&B grades rarely came into play.

When the Master Game came into play, the number of grades increased from 6 to 30, with each grade divided into 5 parts.  There were no additional control or strikeout subratings, but additional subratings were added for homers, wild pitches, balks, hit by pitch and holding runners.  The only ratings that really made a material difference where the homer ratings: 5 additional ratings and approximately 20 effective grades jumped the classes to 1,500.  In a quirk of the computer vs. Master Game, the latter now has an additional control rating and 4 additional strikeout ratings.

A while back, I ran a simulation of the various hit numbers.  I then did the same thing, this time concentrating on the pitching grades.  Instead of drowning you in numbers, I’m going to go the pretty route and drown you with charts.  First up I simply ran a 5-season simulation on every grade from 1 through 30 with all of the ‘neutral’ subratings: no control, no strikeout and no homerun.  Here is a comparison of a few of the stats for each simulation:

APBAPitching1

Continue reading

Is a 14 better than a 9 — Finding Out the Monte Carlo Way (Part 3)

In the introduction, I went over what the heck this project is all about. In part one, I broke down all of the possibilities of the batter-influenced hit numbers. In part two, I went over the error and rare play numbers and found out that everything was pretty much the same. Now we can move on to the parts of the card that won’t help you, the outs.

As I explained in the In the introduction, the APBA card in a “pure” state would consist of a 12, a 31, a 35, the position-determined error and rare play numbers, and a mélange of 26s through 30s and 32s and 34s.  A player’s hits, walks and hit by pitches will slowly remove the mélange.  However, there are other batter actions that will not remove numbers, but at least change them from one out to another:

  • Strikeouts are the most obvious, basically 1 per 36 PA minus 1.1.  So if someone had 5.6 K per 36 PA, that would go down to 4.5, which would round back up to 5.  The subtraction is to account for strikeouts obtained through pitcher subratings and hits into outs.
  • 24s come into play for generally every .0125 GDP per 36 PA, or .0035 GDP per PA.
  • Players with a good hit-and-run reputation receive a second 31.  Players with an excellent reputation receive 3 31’s (only 5 in 2012).
  • 33s and 34s used to be based on a straight batting average formula, .250 and above meant you got one or the other, under .250 you got both.  That no longer seems to be the case as there are some (but not many) players on both sides of the line.  It does not seem to be a function of outs needed or something to do with bat control, as Juan Pierre has the intriguing combo of 3 31’s but both a 33 and a 34, the latter two are DPs on a hit and run.  Nor does it seem to tie to bunting.
  • The good bunt numbers (26, 28, 30 and 32) are given more to good bunters while the bad bunt numbers (27 and 29) are given to the poorer bunters.
  • Extra numbers can also be pull related, with righties tending to get extra 27s, 28s and 30s and lefties 26s, 29s and 32s.

This phase of the project proved to be a little more difficult to implement.  Unlike adding hits, which was merely replacing one out result with the desired hit, adding an out would involve recalculating the card.  I really didn’t want to do that.  So what I did instead was removing 1-11, 14, 22 and 42 proportionally off everyone’s card so that there would be about 7% less of each over the course of the set, replaced by the out number being tested.

Continue reading

Is a 14 better than a 9 — Finding Out the Monte Carlo Way (Part 2)

In the introduction, I went over what the heck this project is all about.  In part one, I broke down all of the possibilities of the batter-influenced hit numbers.  In this part, I examine the error and rare play numbers.

When I was a wee lad, I was playing a game that involved the 1981 Cincinnati Reds.  Johnny Bench was playing first and he made four errors.  I just remember that was unusual but what I didn’t realize at the time that also happened when the same batter was up.  Only later did I realize the simultaneous cleverness and frustration with APBA.  In order to distribute errors without re-rolls, the error numbers have to be split in the offensive lineup.  And what better way to do that than to base it on offensive position.

They are generally distributed based on two factors, the position of the player and the hit by pitches needed:

  • Pitcher: gets a 21 and a 23
  • Infielder: Pretty much distributed league wide so that the 18, 19 and 20s are distributed evenly.  Older sets will likely see more 18s and 20s and less 19s.  The players who need more HBP will get the 19s, the ones who need little HBP will get 20s.  Usually one utility infielder per team gets a 21 instead of 18-20, especially in the American League.
  • Outfielder: 15 for the high HBP folks, 17 for the low HBP folks.

In the basic game, the rare play numbers were mainly used to handle non-at bat situations, such as wild pitches, caught stealing and pickoffs.  In the Master Game, they serve a dual purpose.  The first purpose being wild pitches, balks and pickoffs.  The second purpose is to have actual rare plays: multiple-base errors, ejections, rain outs (grr), injuries and the like.  Those numbers are also mostly distributed by position:

  • Pitcher and Second Base: gets a 36
  • Catcher: gets a 36 and a 38
  • First Base: gets a 37 and 2/3rds also get a 41
  • Third Base and Shortstop: 39
  • Outfielder: 40

There are some variances to have the numbers properly distributed by team.  For example Michael Cuddyer for 2012 Colorado is treated as a first baseman.

Some of the more sophisticated mail leagues created what were called error and/or rare play redistribution charts.  If you rolled a 15-23 or a 36-41, you rerolled this chart to get the actual number.  I bring this whole history lesson up because it is pretty obvious once that the computer game at least uses an error redistribution.  First, he are the error numbers from MLB and my baseline replay, per 36 PA:

Test P C 1B 2B 3B SS LF CF RF
2012 MLB .08 .05 .06 .07 .12 .11 .05 .03 .03
Baseline .06 .11 .06 .08 .10 .15 .05 .03 .04

First thing you see between real-life and APBA is that catchers make way too many errors and pitchers not enough, mostly because with more HBP than ever before more 22s are issued.  The number of errors by 3B has also recently gone up and although APBA has done some changes to catch up (hence the extra 19 and less 18 and 20), it still isn’t enough.  For my leagues, which I use the master game, I actually have era specific error randomizers.

When you look at the results of the various tests, all of the errors go up proportionally, the only variant being HBP.  Here’s the data, ranked from high HBP to low HBP:

Test P C 1B 2B 3B SS LF CF RF HBP
Baseline .06 .11 .06 .08 .10 .15 .05 .03 .04 .23
15 (HBP runner on 1st) .09 .15 .09 .12 .14 .22 .07 .04 .06 .42
22 (HBP runner on 1st) .09 .15 .08 .13 .14 .22 .07 .03 .06 .42
19 (HBP runner on 2nd) .09 .15 .09 .14 .16 .24 .06 .03 .06 .30
17 (HBP runners on 1st and 2nd) .09 .15 .09 .14 .15 .23 .07 .04 .06 .30
18 (HBP runners on 1st and 3rd) .09 .15 .09 .14 .16 .25 .07 .04 .06 .26
16 (HBP runner on 3rd) .10 .15 .09 .14 .16 .24 .07 .04 .06 .25
20 (HBP Bases full) .10 .15 .09 .15 .15 .24 .07 .04 .06 .25
21 (HBP runners on 2nd and 3rd) .10 .15 .09 .14 .16 .25 .07 .04 .06 .25
23 (No HBP) .10 .15 .09 .14 .16 .25 .07 .04 .06 .23

Not surprising at all once you realize that error randomization is going on. Since the error numbers are not always errors, there’s hits or outs in there too, let’s rank them by their runs over baseline potential:

Test R/ 36PA 1B/ 36PA 2B/ 36PA 3B/ 36PA HR/ 36PA BB/ 36PA SO/ 36PA HBP/ 36PA GDP/ 36PA
Baseline 4.04 5.40 1.53 .18 .94 2.80 7.84 .23 .59
22 (HBP runner on 1st) 4.36 5.50 1.53 .18 .94 2.81 7.85 .42 .59
15 (HBP runner on 1st) 4.35 5.49 1.54 .19 .94 2.80 7.85 .42 .61
17 (HBP runner on 1st and 2nd) 4.34 5.50 1.52 .18 .95 2.81 7.77 .30 .58
20 (HBP bases full) 4.34 5.54 1.53 .18 .94 2.80 7.77 .25 .60
19 (HBP runner on 2nd) 4.32 5.54 1.52 .18 .93 2.80 7.76 .30 .58
18 (HBP runners on 1st and 3rd) 4.31 5.50 1.52 .18 .94 2.82 7.78 .26 .59
23 (no HBP) 4.31 5.50 1.52 .18 .94 2.81 7.75 .23 .58
16 (HBP runner on 3rd) 4.30 5.52 1.53 .18 .94 2.81 7.75 .25 .58
21 (HBP runners on 2nd and 3rd) 4.29 5.51 1.52 .18 .93 2.81 7.80 .25 .60

Weird that the 19 as that jump in singles, especially with 19 having more than the average amount of singles on an non-randomized board. Maybe it’s “sort of” randomized? Poring through assembly code was not in scope for this project, so we’ll move on to the comparison:

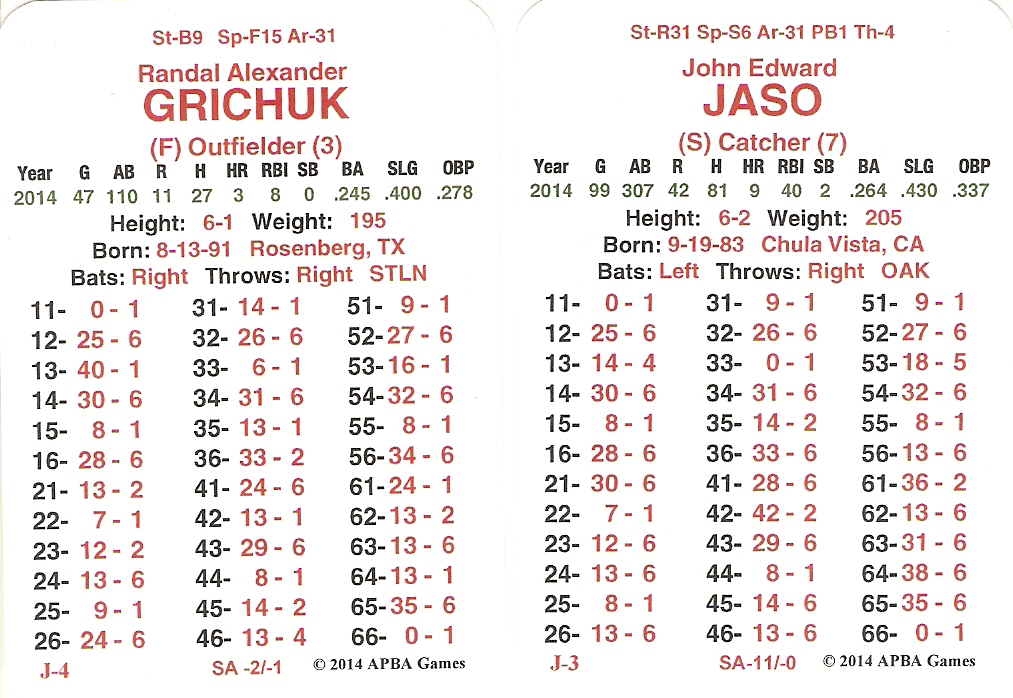
  • Jay Bruce has a 15. Adding .31 (the expected runs for a 15 minus the baseline) to his previous 7.69 now gives him an 8.00
  • Torii Hunter has a 19 and two 22s. Adding .28 for the 19 and .64 (.32 * 2) for the two 22s to his previous 7.51 now gives him an 8.43

Moving on to rare plays, there seems to be somewhat the same randomization as the error plays.  On the boards, the 36 and 40 are the wild pitch possibility, 38 the passed ball possibility, 37 and 39 have possible pickoffs, and 41 is just wacky.  Also, any non-baserunner event could lead to the rare play boards, which can mean more errors.  So let’s pull the baseline in from above, and this time add wild pitches, passed balls, pickoffs and balks to the mix.

Let’s check the new stats, looking at the MLB baseline, APBA baseline and the results from the six play results:

Test WP BK PK PB
MLB .30 .03 .07 .07
Baseline .12 .01 .05 .08
36 .23 .02 .09 .14
37 .23 .02 .09 .13
38 .23 .02 .09 .13
39 .23 .02 .09 .13
40 .23 .02 .09 .13
41 .22 .02 .09 .14

Glaring obvious even from the baseline is the lack of wild pitches and balks.  Even adding an extra chance per card doesn’t produce enough.  As a consequence, the rare plays get called a bit too much, and could inflate the error numbers a bit.  You get about 10% too many errors in a non-adjusted replays, errors that could be taken away with wild pitches and balks.  Anyway, here is the breakdown for the different numbers when it comes to errors, and it’s not much different by number, furthering the randomization theory:

Test P C 1B 2B 3B SS LF CF RF
Baseline .06 .11 .06 .08 .10 .15 .05 .03 .04
36 .07 .13 .07 .09 .12 .16 .07 .04 .06
37 .07 .13 .07 .09 .12 .15 .07 .04 .06
38 .07 .13 .07 .09 .12 .15 .07 .04 .06
39 .07 .13 .07 .09 .11 .16 .07 .04 .06
40 .07 .13 .07 .09 .11 .16 .07 .04 .06
41 .07 .13 .07 .09 .11 .16 .07 .04 .06

Not quite to the level of adding to the errors that a error number does, but there is a noticeable increase.  But the important question is, of course, how does this translate to runs:

Test R/ 36PA 1B/ 36PA 2B/ 36PA 3B/ 36PA HR/ 36PA BB/ 36PA SO/ 36PA HBP/ 36PA GDP/ 36PA
Baseline 4.04 5.40 1.53 .18 .94 2.80 7.84 .23 .59
36 4.32 5.62 1.56 .18 .96 2.84 7.90 .23 .58
37 4.32 5.66 1.58 .19 .95 2.83 7.84 .23 .59
38 4.31 5.62 1.56 .19 .96 2.85 7.89 .23 .59
39 4.31 5.65 1.56 .18 .96 2.83 7.88 .23 .59
40 4.29 5.61 1.56 .19 .96 2.85 7.90 .23 .59
41 4.29 5.61 1.56 .19 .96 2.85 7.90 .23 .59

A little surprising that despite little variation between the various non-hit elements, the hit elements are a bit different, and therefore the runs by number are slightly different.  Nevertheless, the number does produce some runs over average, and those players who get two of them have a bit more value than those who get one.

Back to our comparison of Jay Bruce and Torii Hunter, there isn’t a difference here, since being outfielders they each have a 40.  Add .25 to each of their scores (4.29 – 4.04), giving Bruce 8.40 and Hunter 8.68.

We move on to our next installment, the plays that will be knocking Bruce’s and Hunter’s scores down, the out numbers.  You will soon learn that not all out numbers are created equal.

NOTE: Edited on 7/22/2013 to reflect Torii Hunter’s 2 22s and the use of scaling from Part 1.

Is a 14 better than a 9 — Finding Out the Monte Carlo Way (Part 1)

In the introduction, I explained a set of tests I did to find out the true value of an APBA baseball card.  This section will deal with the valuation of those numbers that the hitter controls to some extent: hits, walks and hit by pitch.  The error and rare play numbers will be in a future post.

Before we get started, let’s establish what the Major Leagues did on a divided by 36 plate appearances for the 2012 season:

Test R/36PA 1B/36PA 2B/36PA 3B/36PA HR/36PA BB/36PA SO/36PA HP/36PA GDP/36PA
2012 MLB 4.11 5.46 1.61 .18 .96 2.88 7.12 .29 .71

I played 5 seasons with the 5.75 computer game using Buck Jr. as the manager. The numbers were fairly close:

Test R/36PA 1B/36PA 2B/36PA 3B/36PA HR/36PA BB/36PA SO/36PA HP/36PA GDP/36PA
Baseline 4.04 5.40 1.53 .18 .94 2.80 7.84 .23 .59
Difference -.07 -.06 -.08 +.00 -.02 -.08 +.72 -.06 -.12

Runs are down a little bit, mostly due to a combination of my over-zealousness of making sure I didn’t have to manually fiddle with lineups by giving some scrubs more playing time, and the micromanager using the better pitchers a little more often than he should.  For comparison purposes, these are fine numbers and can be used as a baseline when I start adding numbers to the cards and running the simulations.

Continue reading

Is a 14 better than a 9 — Finding Out the Monte Carlo Way (Intro)

My APBA playing involves a solo league I put together 16 years ago.  The premise is I make either 6, 8, 10 or 12 teams out of that major league season and play a 30 game schedule using the Master Game and the approximately one million innovations I’ve added through the years.  So far I’ve played 35 seasons with every season since 1996, most of the 60s, and some scattered years from the past.  One of the things I have to do is come up with the base lineup(s) for each team.  In the modern area, it usually involves two lineups because of the more pronounced platoon splits.

One decision I had to come up with this year for a team is the rightfield position that came down between Jay Bruce and Torii Hunter.  Normally I would look at a formula that is essentially modified OPS (with an addition/subtraction for SB/CS) and make sure the platoon situation wasn’t terribly weird in one way or another.  My formula had a very close call between the two, showing that classic tough call on do you go complete player over raw power.

St-E29 Sp-10 Ar-37
Jay Allen
BRUCE
Outfielder (3)
11- 5 31- 9 51- 14
12- 25 32- 26 52- 27
13- 14 33- 5 53- 15
14- 30 34- 31 54- 32
15- 10 35- 40 55- 8
16- 28 36- 33 56- 13
21- 32 41- 26 61- 29
22- 6 42- 13 62- 13
23- 12 43- 29 63- 32
24- 13 44- 8 64- 13
25- 9 45- 14 65- 25
26- 13 46- 13 66- 1
J-1 PR-6/+1
St-F-34 Sp-13 Ar-35
Torii Kedar, Sr. “Spiderman”
HUNTER
Outfielder (3)
11- 0 -1 31- 8 -1 51- 9 -1
12- 25 -7 32- 26 -7 52- 27 -7
13- 22 -6 33- 0 -1 53- 19 -6
14- 30 -6 34- 31 -6 54- 32 -6
15- 10 -1 35- 9 -1 55- 8 -1
16- 13 -6 36- 14 -6 56- 13 -6
21- 40 -6 41- 24 -8 61- 24 -3
22- 7 -1 42- 9 -6 62- 13 -6
23- 12 -6 43- 29 -7 63- 31 -6
24- 13 -6 44- 7 -1 64- 22 -5
25- 8 -1 45- 14 -6 65- 35 -8
26- 13 -6 46- 13 -6 66- 0 -1
J-2 SA +2/-2

So I began to wonder: what is the true value of an 9, or a 14, or a penalty for a 24, in the context of runs?

Continue reading

Introduction

I’ve been playing APBA since I was 10.  Over the years, I’ve noticed things that sometimes fall in the space of “do I ignore it and keep it real” or “do I take advantage of it and have it be a little odd.”  Setting up your outfield based on the other team’s error numbers, playing high shot forwards during penalty kills, etc.  Since I don’t want to clutter my regular blog with this, I’ve set up this one to be the place for my brain droppings when it comes to APBA.